Bottom line
September’s citywide median tells only part of the story. Three charts help buyers read luxury sales, available inventory and contract timing before comparing individual residences.
How to use this guidance
Use the guidance to frame questions before comparing West Palm Beach buildings. Then check project pages, current floor-plan packets, source-linked updates, and The Scott Gordon Group at Douglas Elliman for the details that can change.
Start with the right comparison
West Palm Beach’s September condo and townhome report offers two seemingly different signals: closed sales rose 4.9% from a year earlier, while the median sale price fell 7.0% to $330,000. Both figures describe the citywide market across price points. Neither establishes what a waterfront residence should cost. Source: September city report, page 18
For a luxury buyer, the useful questions are more specific. How much activity occurred near your budget? How many competing homes were available? And what does a market statistic actually measure?
The charts below separate those questions, using one quarterly West Palm Beach condo series and a broader monthly Palm Beach County report. Read each within its own geography and time period.
Luxury closings increased modestly
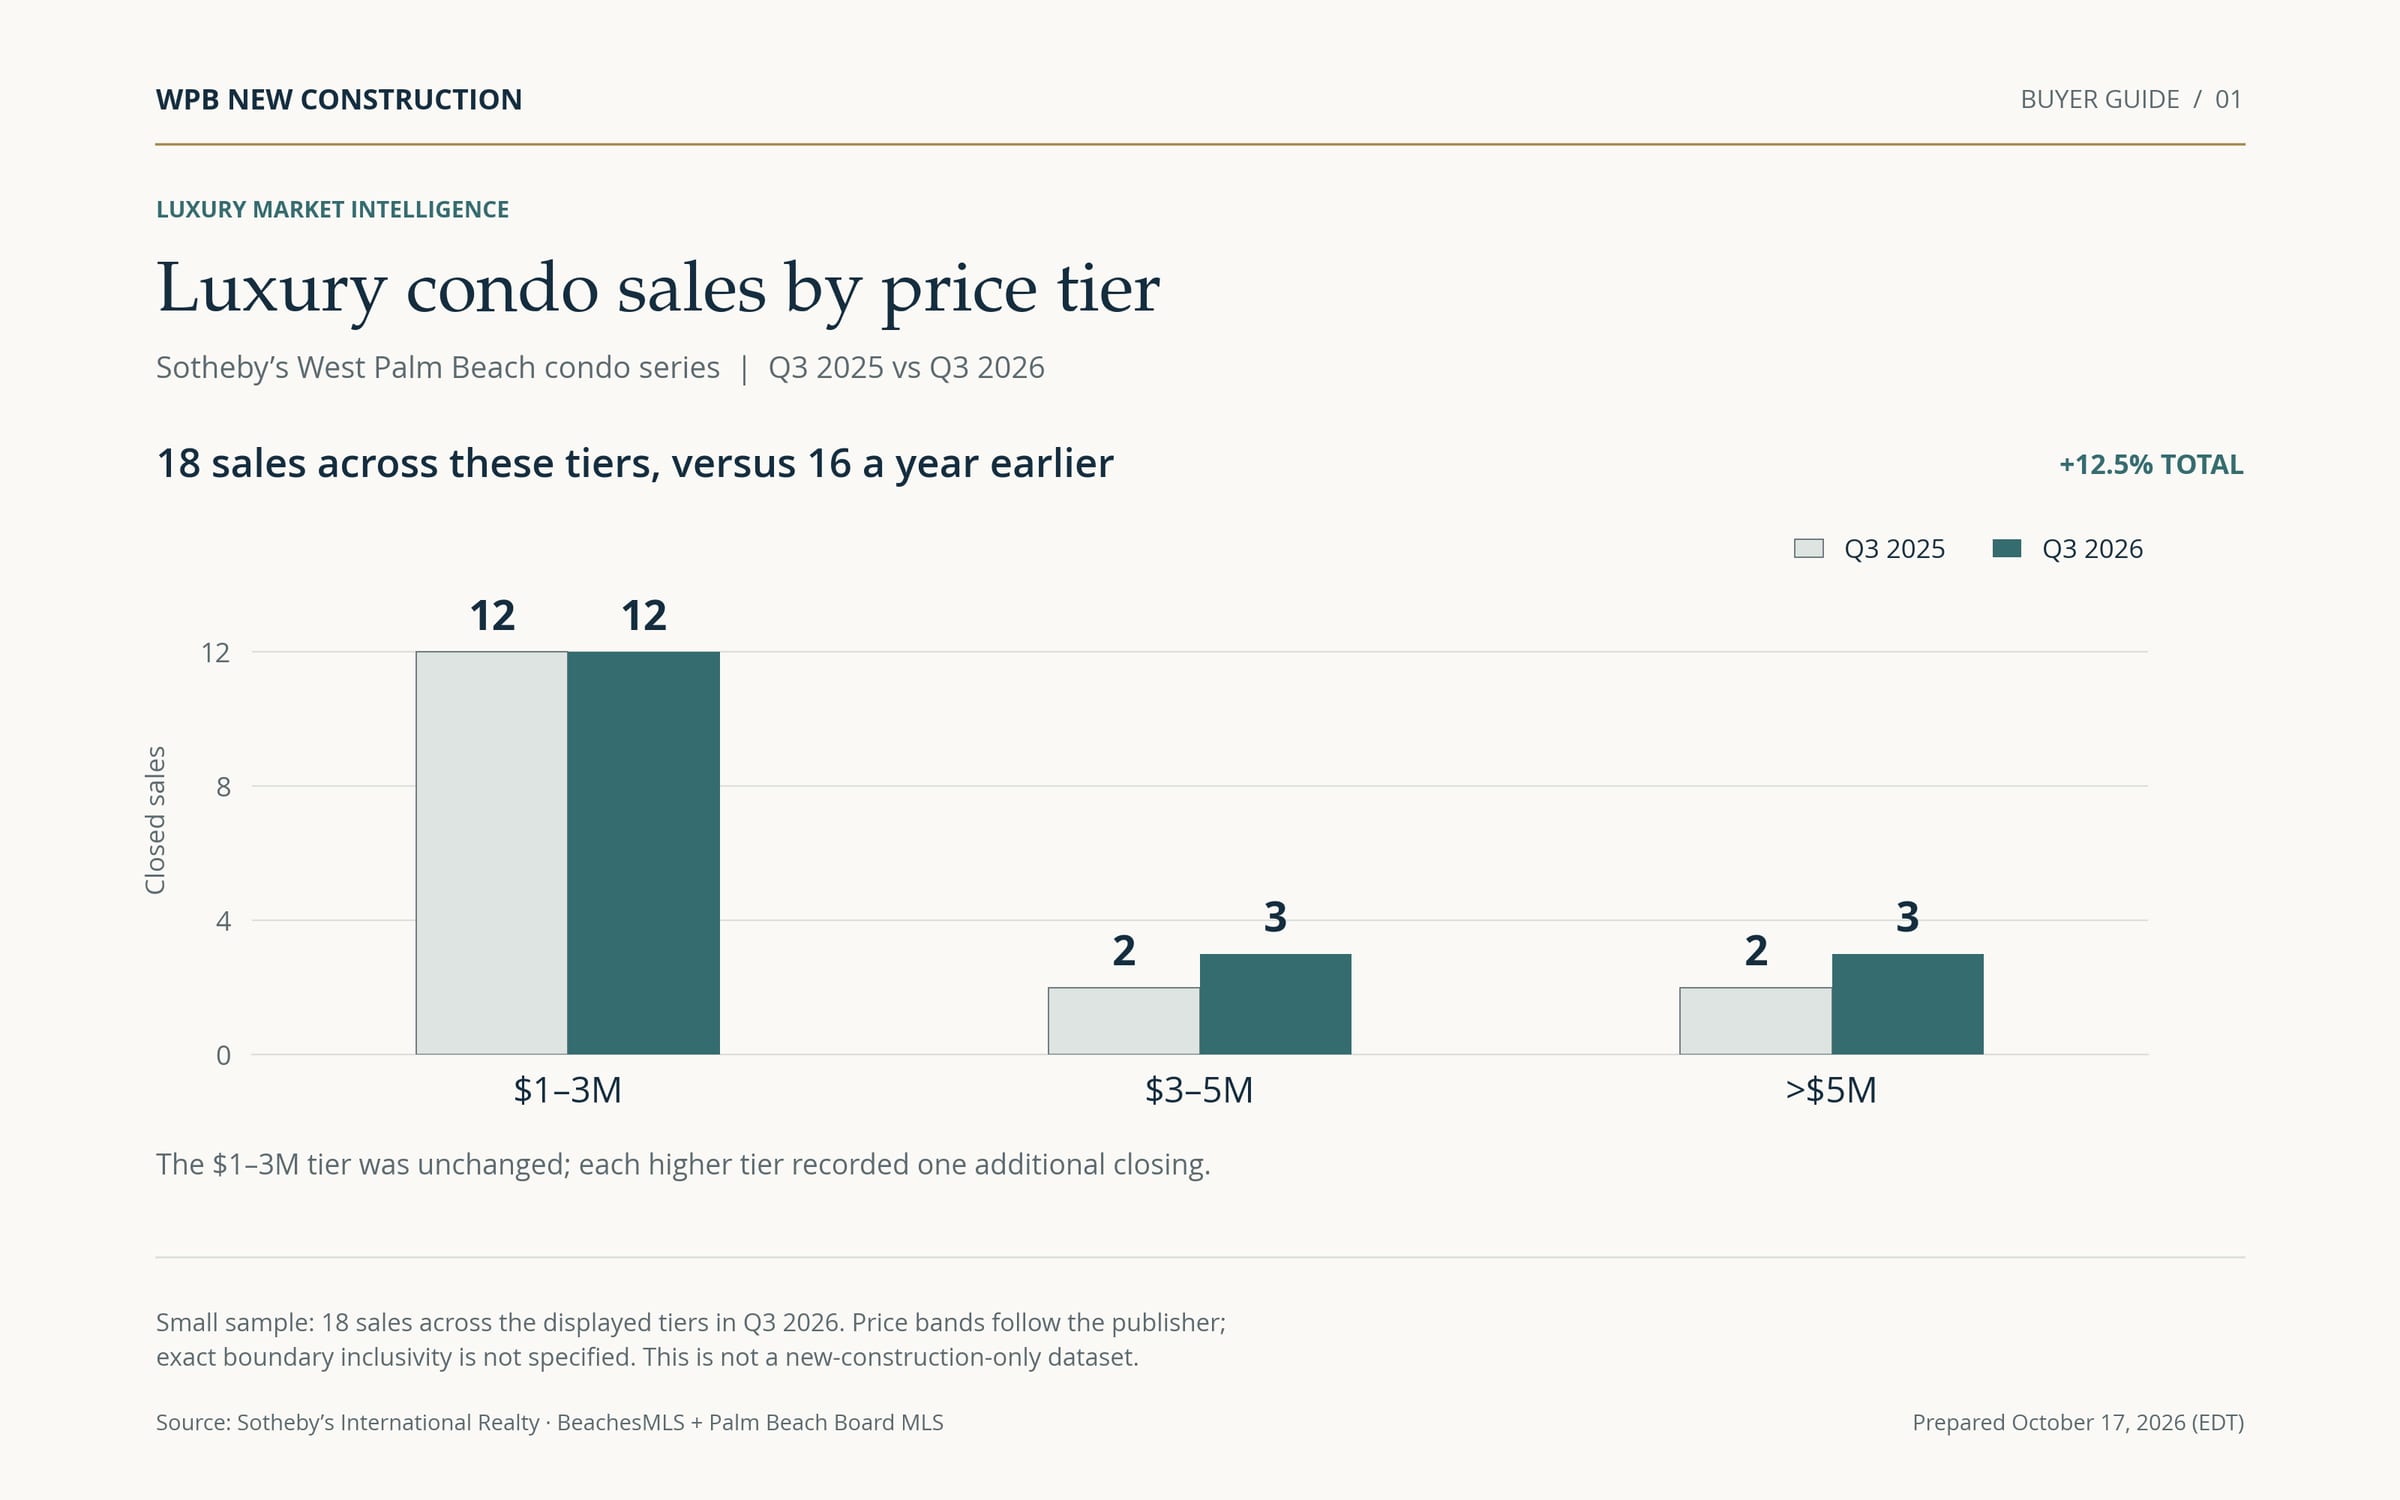
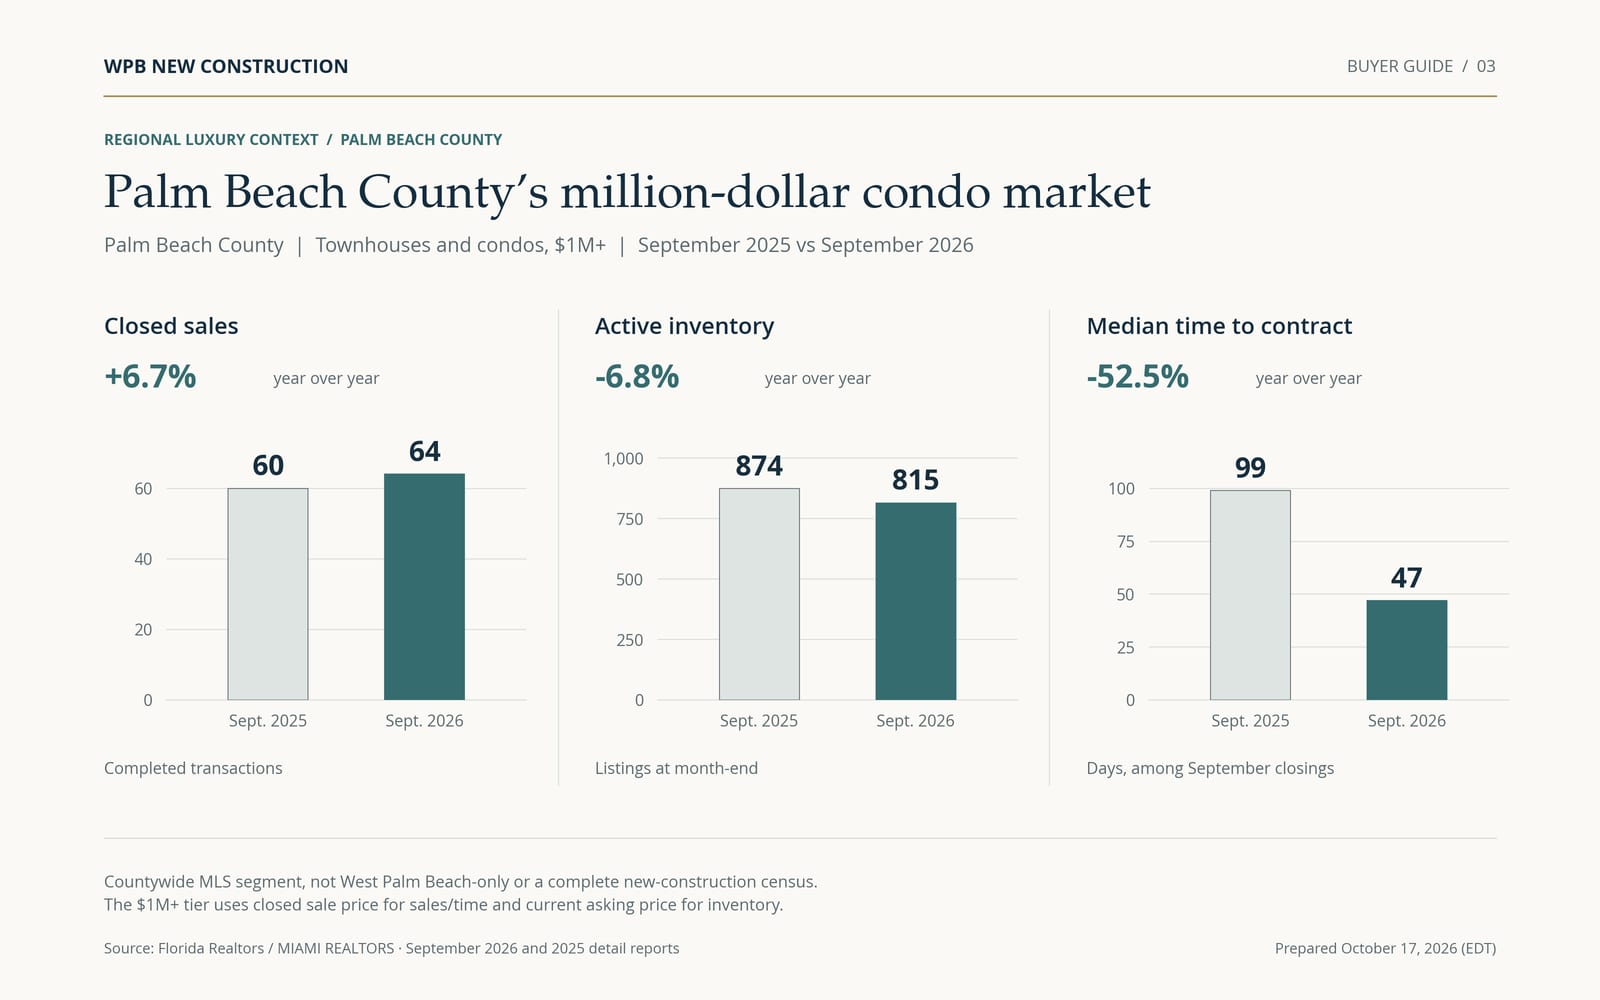
In Sotheby’s West Palm Beach condo series, the three published price bands starting at $1 million recorded 18 closings in Q3 2026, compared with 16 in Q3 2025. The $1–3 million band held at 12 sales. The $3–5 million and over-$5 million bands each increased from two sales to three. Source: Sotheby’s Q3 report
Across all price levels in that same series, sales rose from 106 to 145. Homes below $1 million accounted for 37 of the 39 additional closings, while the overall median fell from $340,000 to $325,000.
That combination is consistent with a change in the mix of homes sold. It cannot establish how much an individual luxury home gained or lost in value. A median describes the middle transaction in a particular group; the homes making up that group change. Definition: Florida Realtors
For your shortlist, ask for recent closed comparables in the same building or a genuinely similar one. Floor, orientation, interior area, condition and outdoor space help explain the differences a market-wide median cannot capture.
Available choice varies by budget
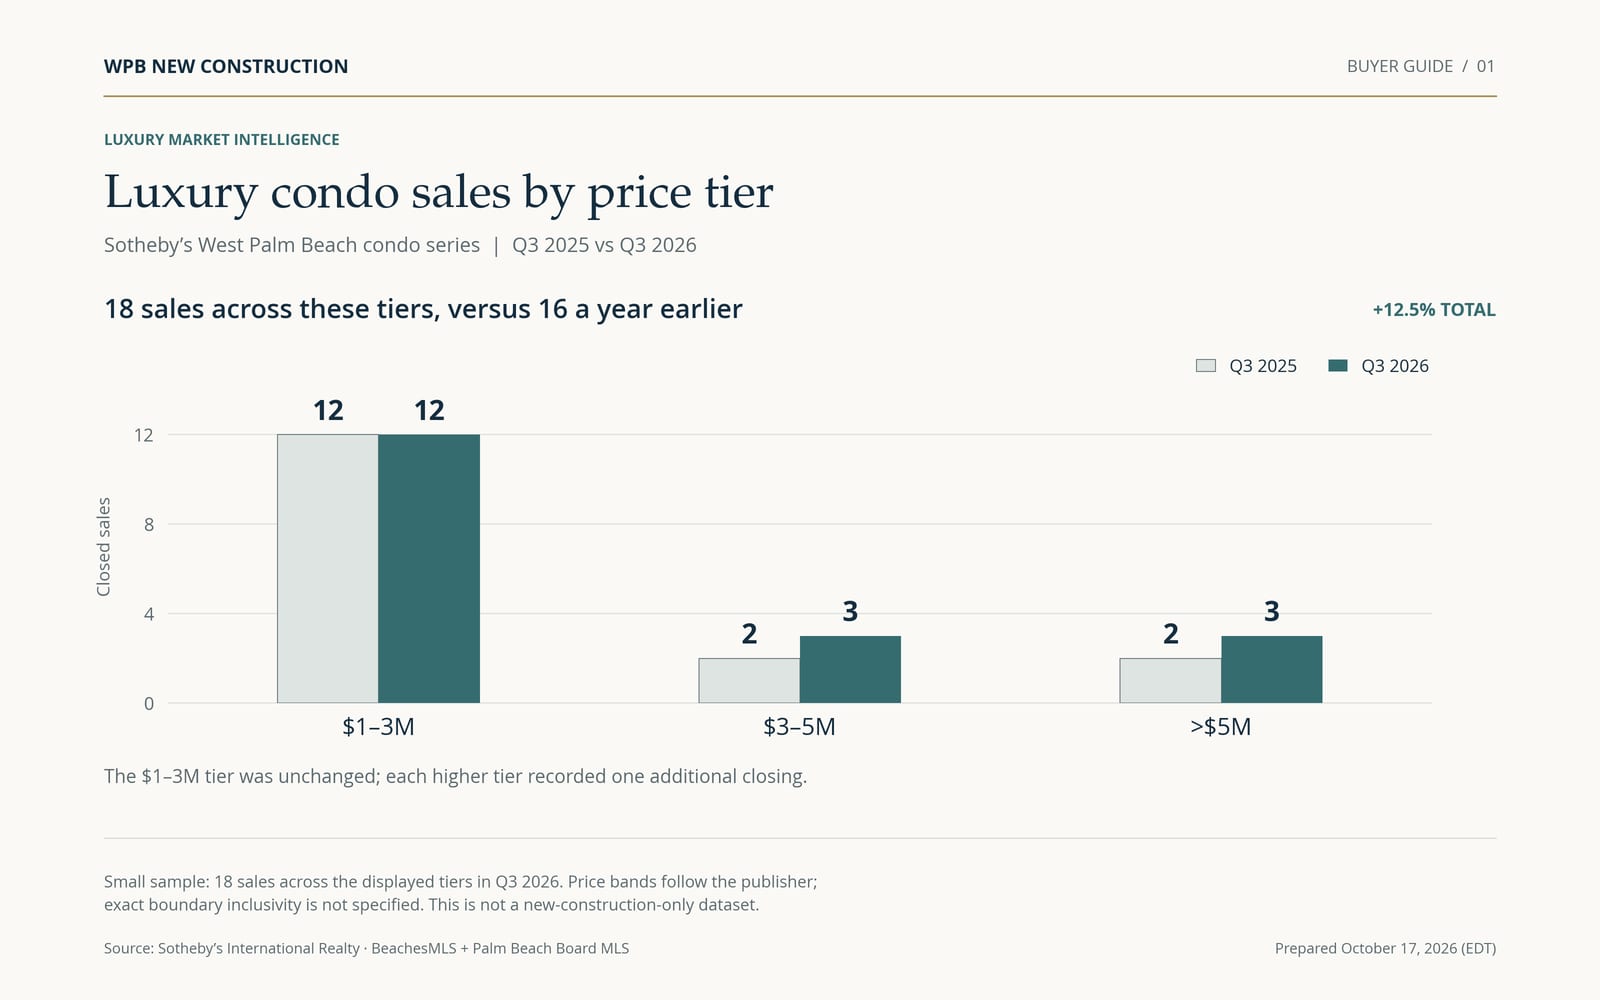
At September 30, Sotheby’s reported 33 active listings in the $1–3 million band, 26 in the $3–5 million band and 48 above $5 million. Its corresponding supply readings were 8.3, 26 and 48 months. Source: Sotheby’s Q3 report
Those supply figures are consistent with inventory divided by Q3’s average monthly sales. That formula is inferred from the displayed values, rather than explicitly published. With just three quarterly closings in each upper band, a few transactions can substantially change the reading.
Use this as a prompt to inspect the alternatives carefully. A large inventory total may contain homes that do not fit your needs, and months of supply does not predict how long a particular residence will take to sell. The relevant competition is the set of homes you would seriously consider buying.
Countywide, September contracts came together faster
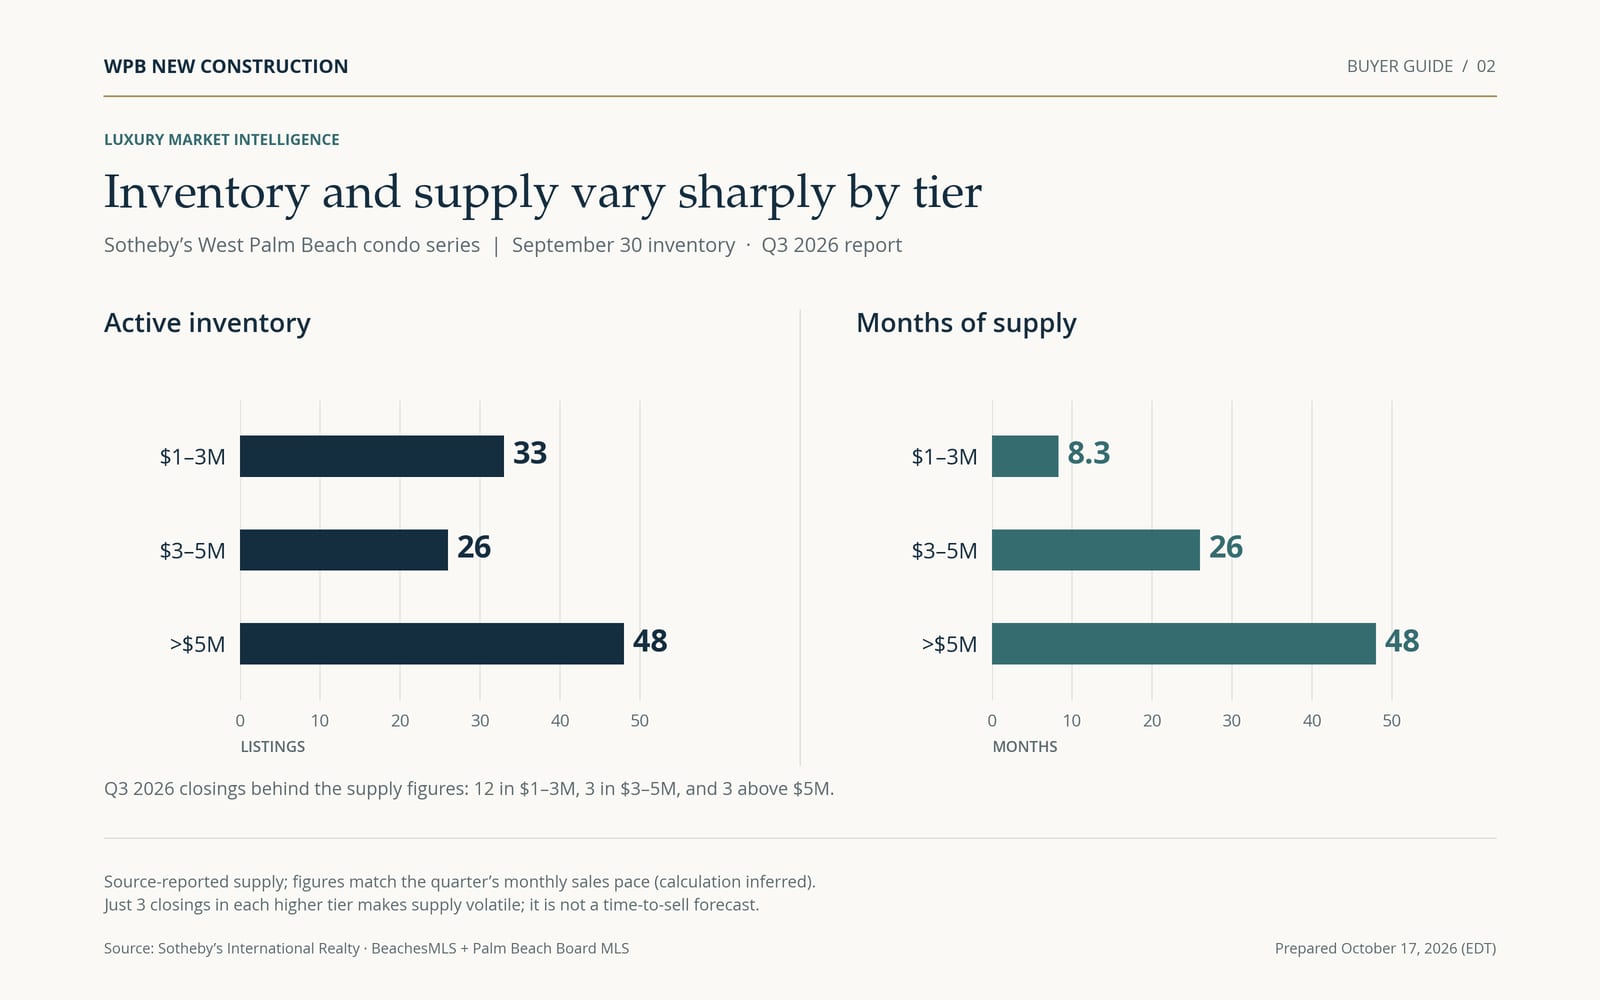
Palm Beach County’s official townhouse and condo report provides a separate view of the $1 million-or-more segment. Comparing September 2026 with September 2025:
Closed sales increased from 60 to 64, up 6.7%.
Month-end active listings declined from 874 to 815, down 6.8%.
Median time to contract fell from 99 to 47 days, down 52.5%.
Sources: September 2026 county report and September 2025 county report.
The timing definition matters: 47 days is the median interval between listing and contract for properties that closed in September. It does not describe every home still for sale, or the time from contract to closing. Sales and contract-time categories use the final sale price; active inventory is grouped by current asking price.
These countywide figures show more completed sales, fewer active listings and a shorter contract interval among September closings. They do not establish the pace in a specific West Palm Beach building.
Turn the charts into a better buying decision
For a practical comparison, bring four questions to each residence:
1. Which completed sales support the asking price? Compare like-for-like homes and separate closed transactions from current asking prices.
2. What are the credible alternatives today? Confirm the exact residence, floor plan, view, parking and availability. A broad inventory count cannot do that work for you.
3. What will ownership actually cost? Compare current association fees, taxes, insurance, reserves and any disclosed assessments, with appropriate professional review.
4. Does the timing fit your plans? For a completed home, inspect what exists. For a development purchase, review current construction status, deposit schedule and contract terms with your advisers. Keep projected delivery separate from a confirmed occupancy plan.
Start with the building comparison and the guide to preconstruction versus completed condos. Then test the shortlist against current, residence-specific information.
Sources and scope
Data reviewed October 17, 2026. Sotheby’s uses BeachesMLS and Palm Beach Board of Realtors MLS, with data through September 30 and an October 6 update. Its precise geographic filters and price-band boundary inclusivity are not disclosed. County figures come from Florida Realtors MLS reports distributed by MIAMI REALTORS/RWorld. These datasets cover different places, property types and periods. None isolates new construction or provides a complete census of developer-direct inventory and contracts. The charts describe recorded activity, not individual property values or future returns.
Reviewed sources
- Sotheby’s West Palm Beach condos, Q3 2026 (updated October 6, 2026)
- MIAMI REALTORS / RWorld September 2026 city report (West Palm Beach, page 18)
- Palm Beach County townhouses and condos, September 2026 (released October 16, 2026)
- Palm Beach County townhouses and condos, September 2025 (released October 23, 2025)
- Florida Realtors market research glossary: median prices, inventory and contract timing